We are getting close to finishing our unit about rate of change and slope. A couple weeks ago students tested their skills at creating videos that demonstrated rate of change. The idea came from this Graphing Stories website. Students came up with an idea and then created a video using an app called Animoto to demonstrate rate of change. They then created a graph that represented what was in their video. Below is am example of a video created.
|
It was a great first week of the school year! Not only am I ecstatic to finally have my very own classroom, but I am excited about the students that I have the opportunity to work with this year and am looking forward to all the fun we will have learning math. We started out this week getting to know each other with a Challenge. Students were put in groups and instructed to build a freestanding tower using only spaghetti noodles, a marshmallow, string, and tape. We discussed group expectations, and how to go about solving a problem. Students came up with some very interesting ideas to complete the challenge and the winning team was in 7th hour with a tower of about 50 cm tall! 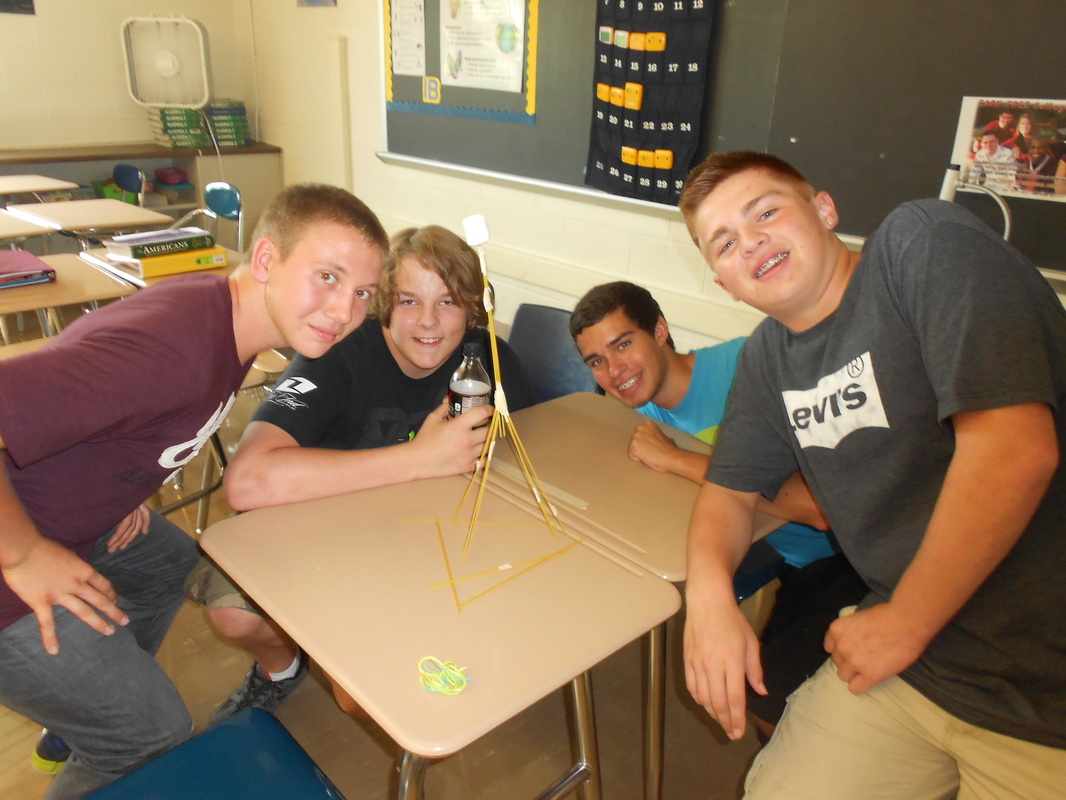
7th Hour winning team!
Here are some of the other towers students constructed. Challenge idea was from this blog post.

In honor of Pi Day (3-14), students explored the meaning of pi. As a class we read the books "Sir Cumference and the First Round Table" and "Sir Cumference and the Dragon of Pi" to learn terms and discover how to find pi. We then did our own exploring of what pi is by finding the circumference and diameter of cookies and other objects. Below are pictures of our exploration. 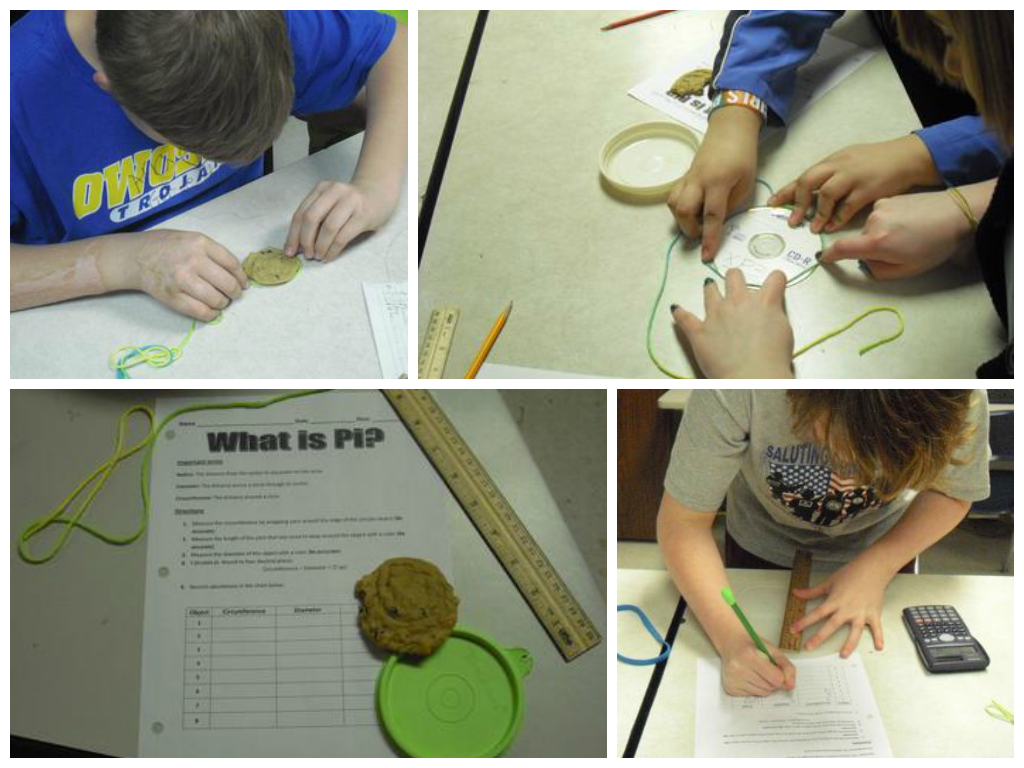
Inspired by the video "We're All in This Together", I created a similar video with my students. 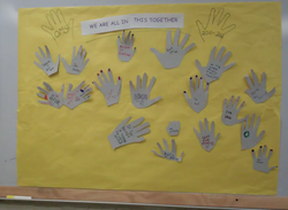
|
Mrs. Atkinson
This blog is a showcase of Mrs. Atkinson's students' math work. Archives
March 2015
Categories |
 RSS Feed
